
Environmental Exhibits
Environmental Exhibits highlight the natural and built conditions that shape planning, redevelopment, and real estate decisions. While this example maps critical facilities in relation to FEMA Flood Zones A and AE in Dade City, the broader category reflects Craig Spatial’s ability to produce natural‑resource layers for projects in Florida or any location.
Craig’s background includes digitizing hydrography with the Minnesota Department of Natural Resources, where he first learned to build and maintain water‑based datasets before attending graduate school. That experience carries into current work mapping environmental features wherever reliable data is available. With the right datasets or a defined task, Craig Spatial can develop layers for wetlands, stormwater systems, soils, conservation areas, tree canopy, wildlife buffers, and other features used in permitting, hazard mitigation, and land‑focused real estate analysis.
Environmental Exhibits continue to grow as an area of practice, supporting planning, environmental review, and property evaluation. This work helps clarify how land functions and how natural systems interact in a given area.
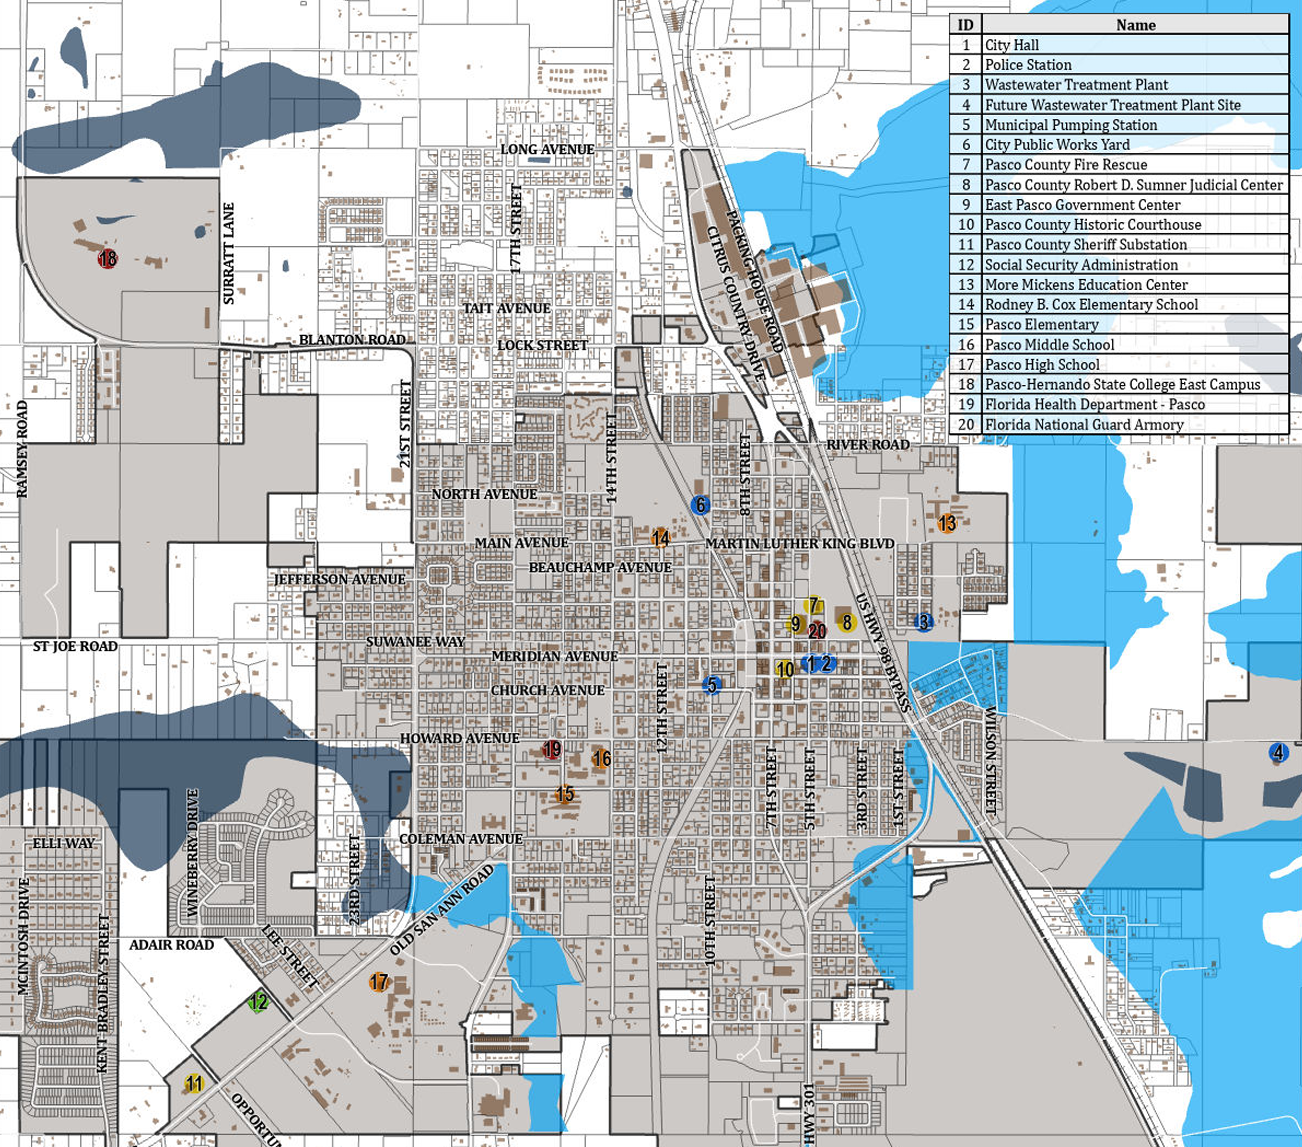
Showing Flood Zone A in navy and Flood Zone AE in light blue, this map illustrates the proximity of critical facilities to the flood zones for the Emergency Response, Recovery & Operations (ERRO) Plan as required by FEMA. City facilities are shown in blue, county facilities in yellow, federal facilities in green, school board sites in orange, and state facilities in red.