
Utilities GIS
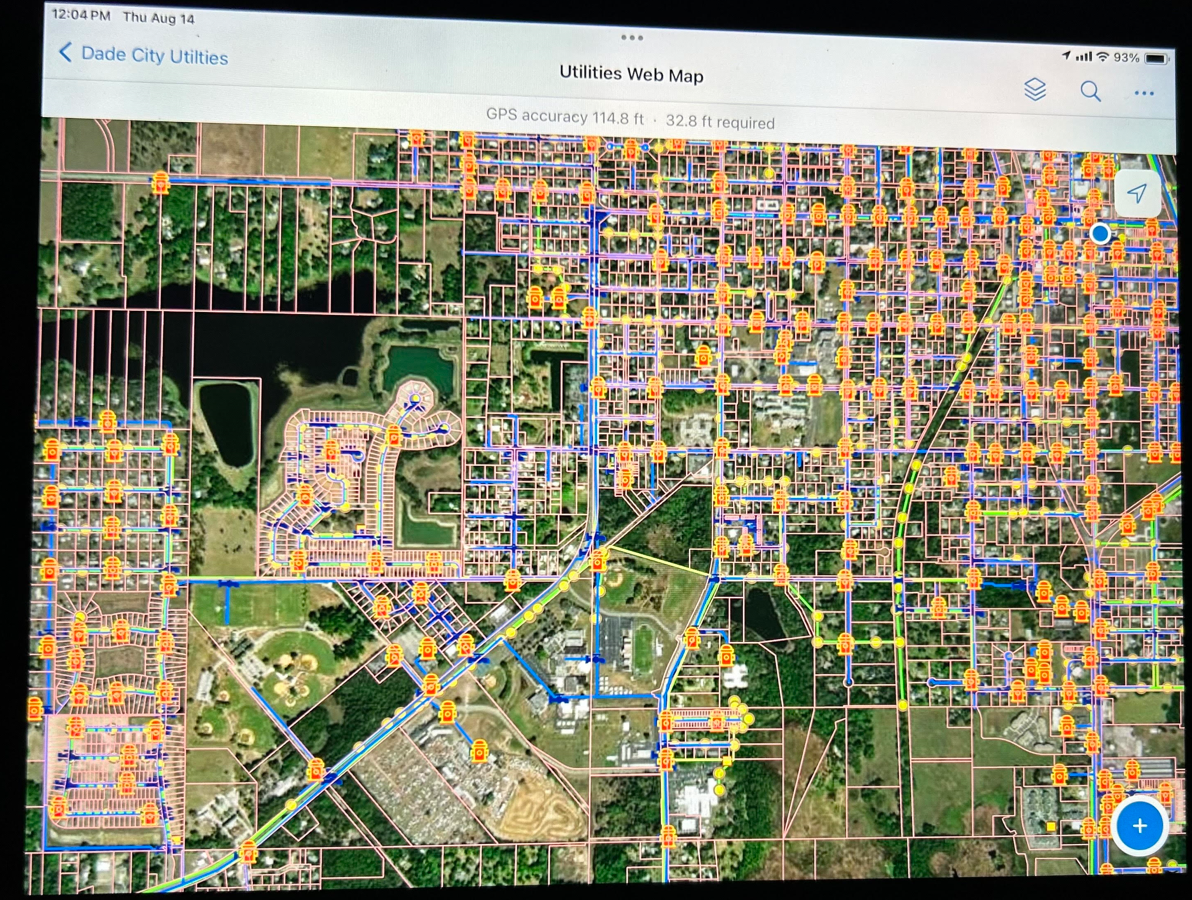
This project was completed during Craig Hanson’s time working for the City of Dade City, FL, where he contributed to the Utilities GIS on an ongoing basis with the goal of building an asset management system from scratch, something the City had always needed. His role was supporting asset management and field operations. The Utilities team collaborated on a shared web map, using Esri ArcGIS Field Maps for data editing and updates and Cartegraph, a third‑party platform, for tracking work orders. Utility data had been inconsistent and scattered across the server, so Craig helped combine old paper maps, legacy CAD drawings, and the field crew’s local system knowledge to sync the data across multiple platforms. This process involved reaching out to engineers for drawings of the new developments.
One of the ongoing challenges was accurately mapping and integrating new infrastructure in this rapidly growing suburb of Tampa, including new water pipelines, sewer gravity mains, forcemains, lateral lines, hydrants, valves, lift stations, and meters. GPS accuracy improved to about 10–15 feet when stepping outside of concrete buildings, which helped with field verification and updates.
Craig Spatial also integrated GPS‑quality public works data (signs, sidewalk conditions, trees, lights, and other assets) into the asset management service so field workers could access everything in one place. Craig printed and plotted multiple paper maps and larger poster‑size maps to update the legacy maps hanging in field offices. The goal was always to make the utilities system clearer and easier to access, and to set up a system that could continue to update the Utilities GIS network as the system grows.
The goal was always to make the utilities system clearer and easier to access, and to set up a system that could continue to update the Utilities GIS network as the system grows.
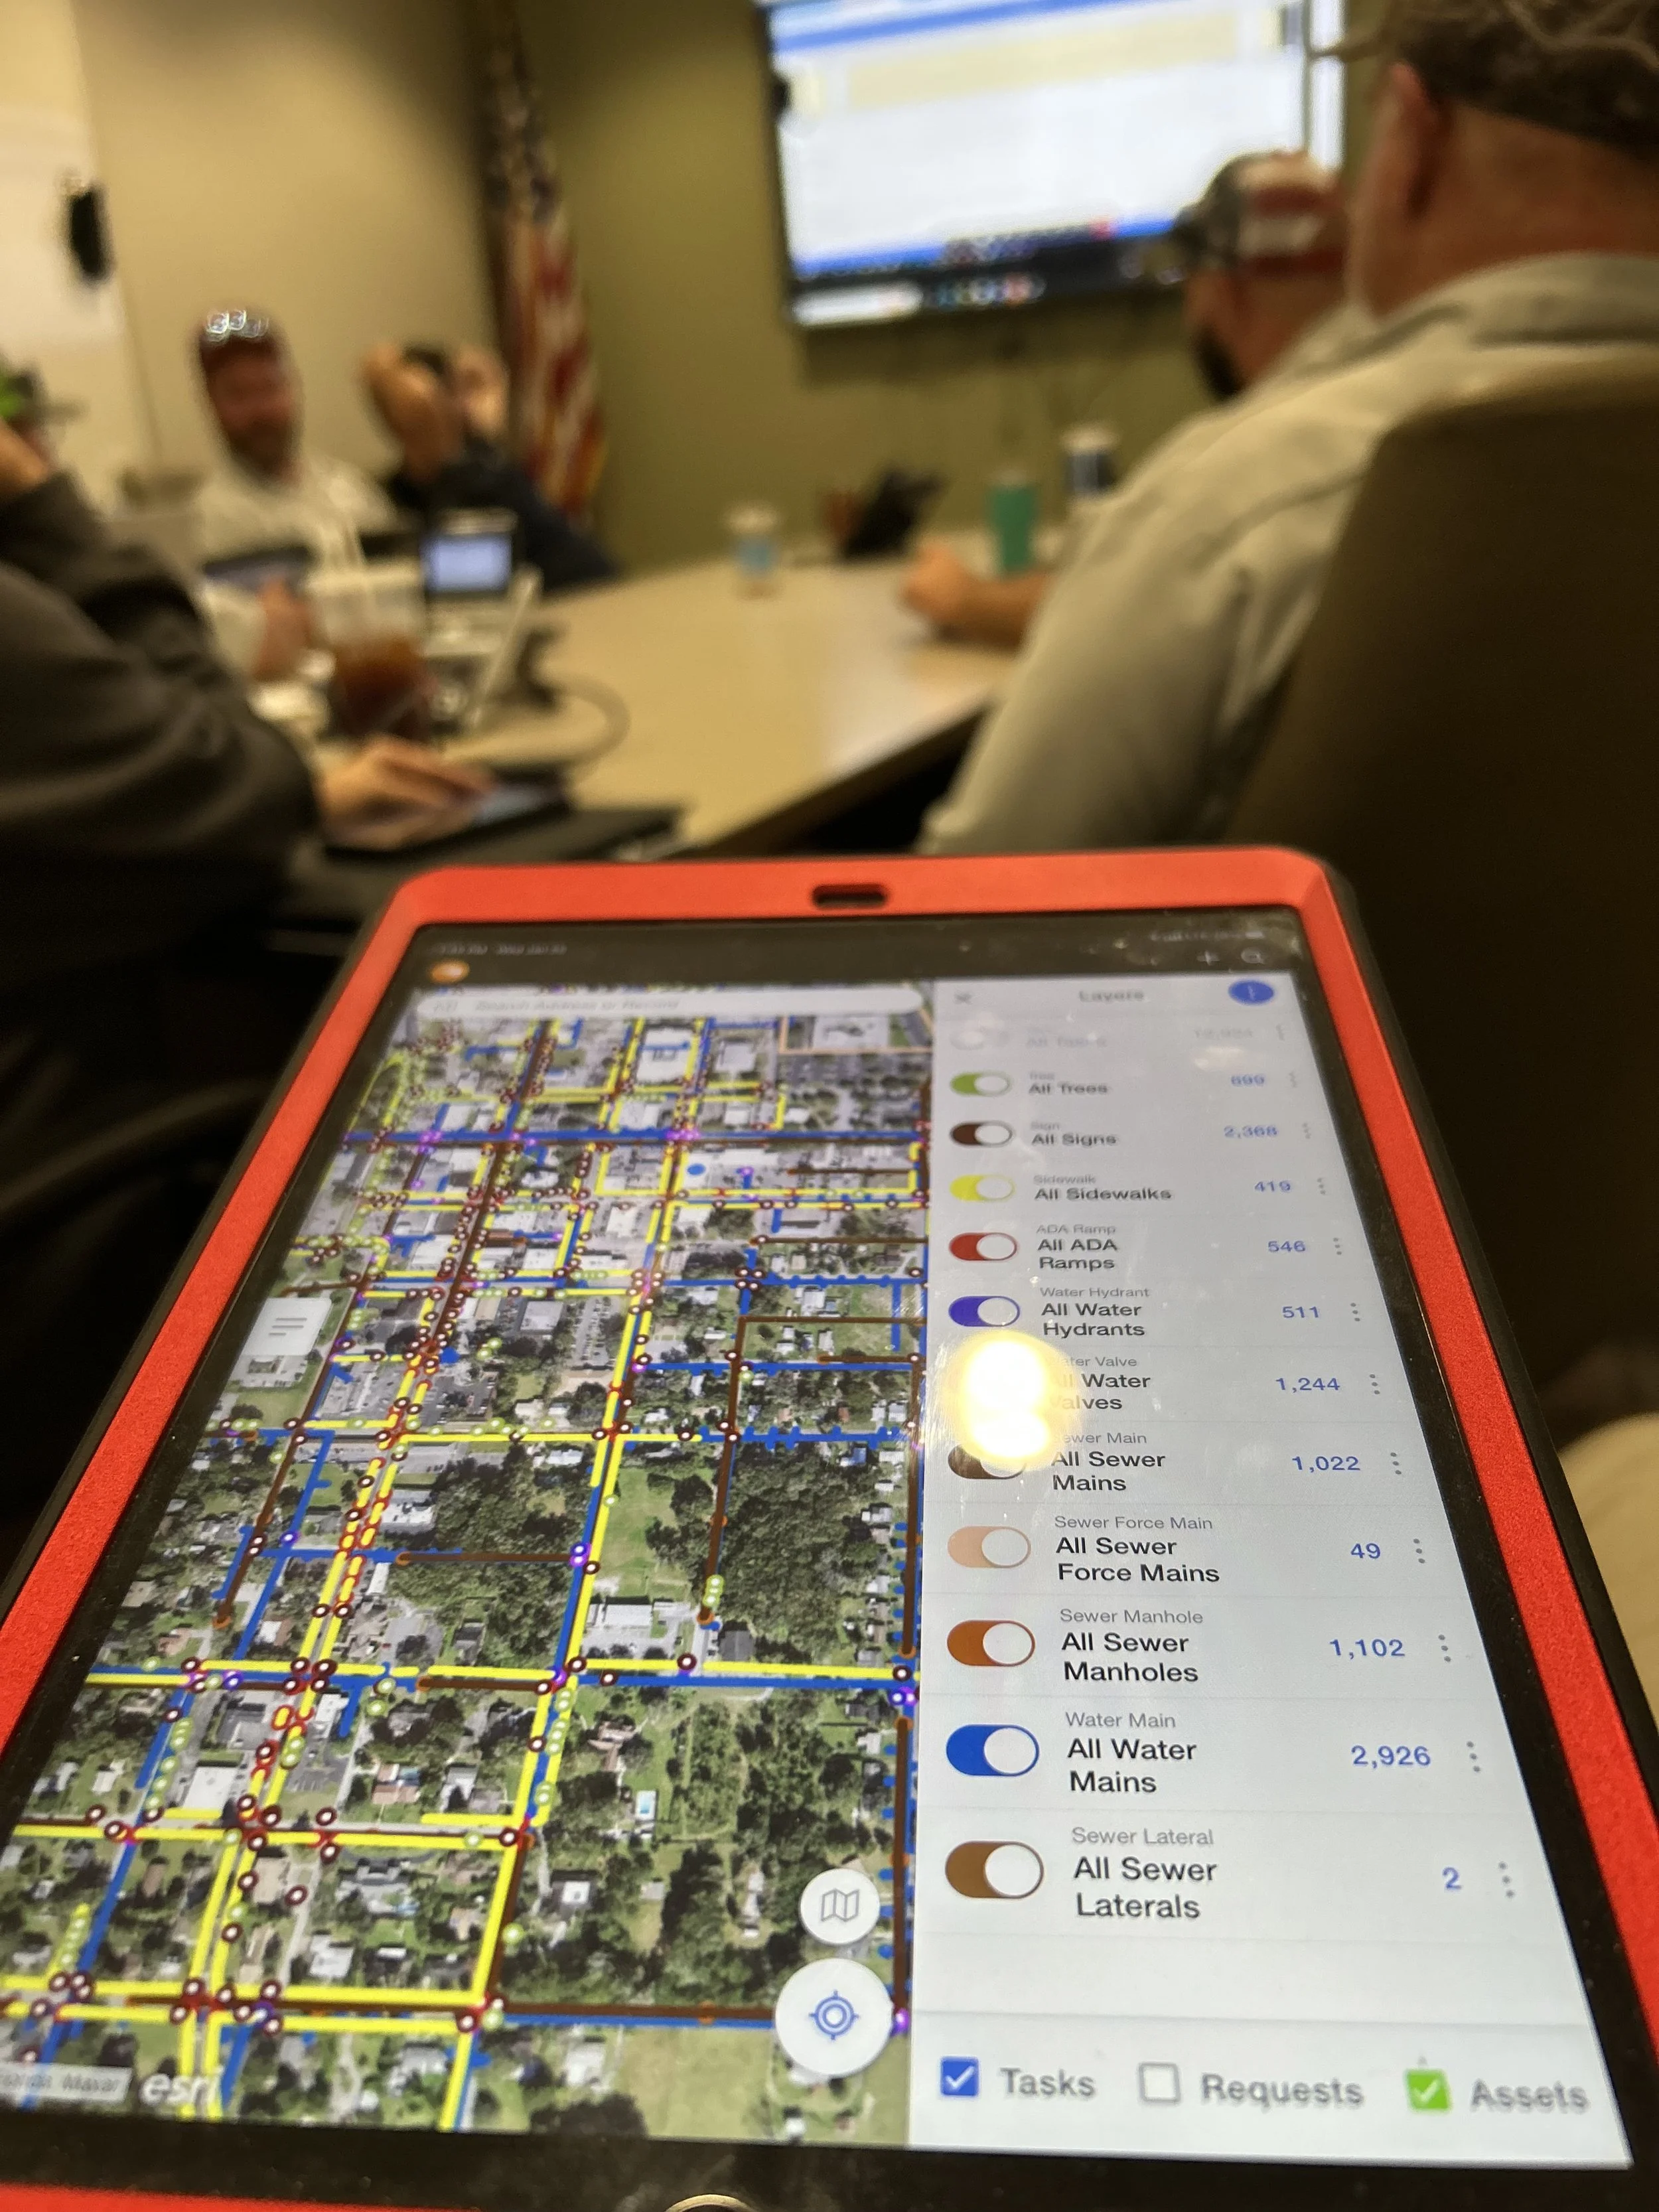
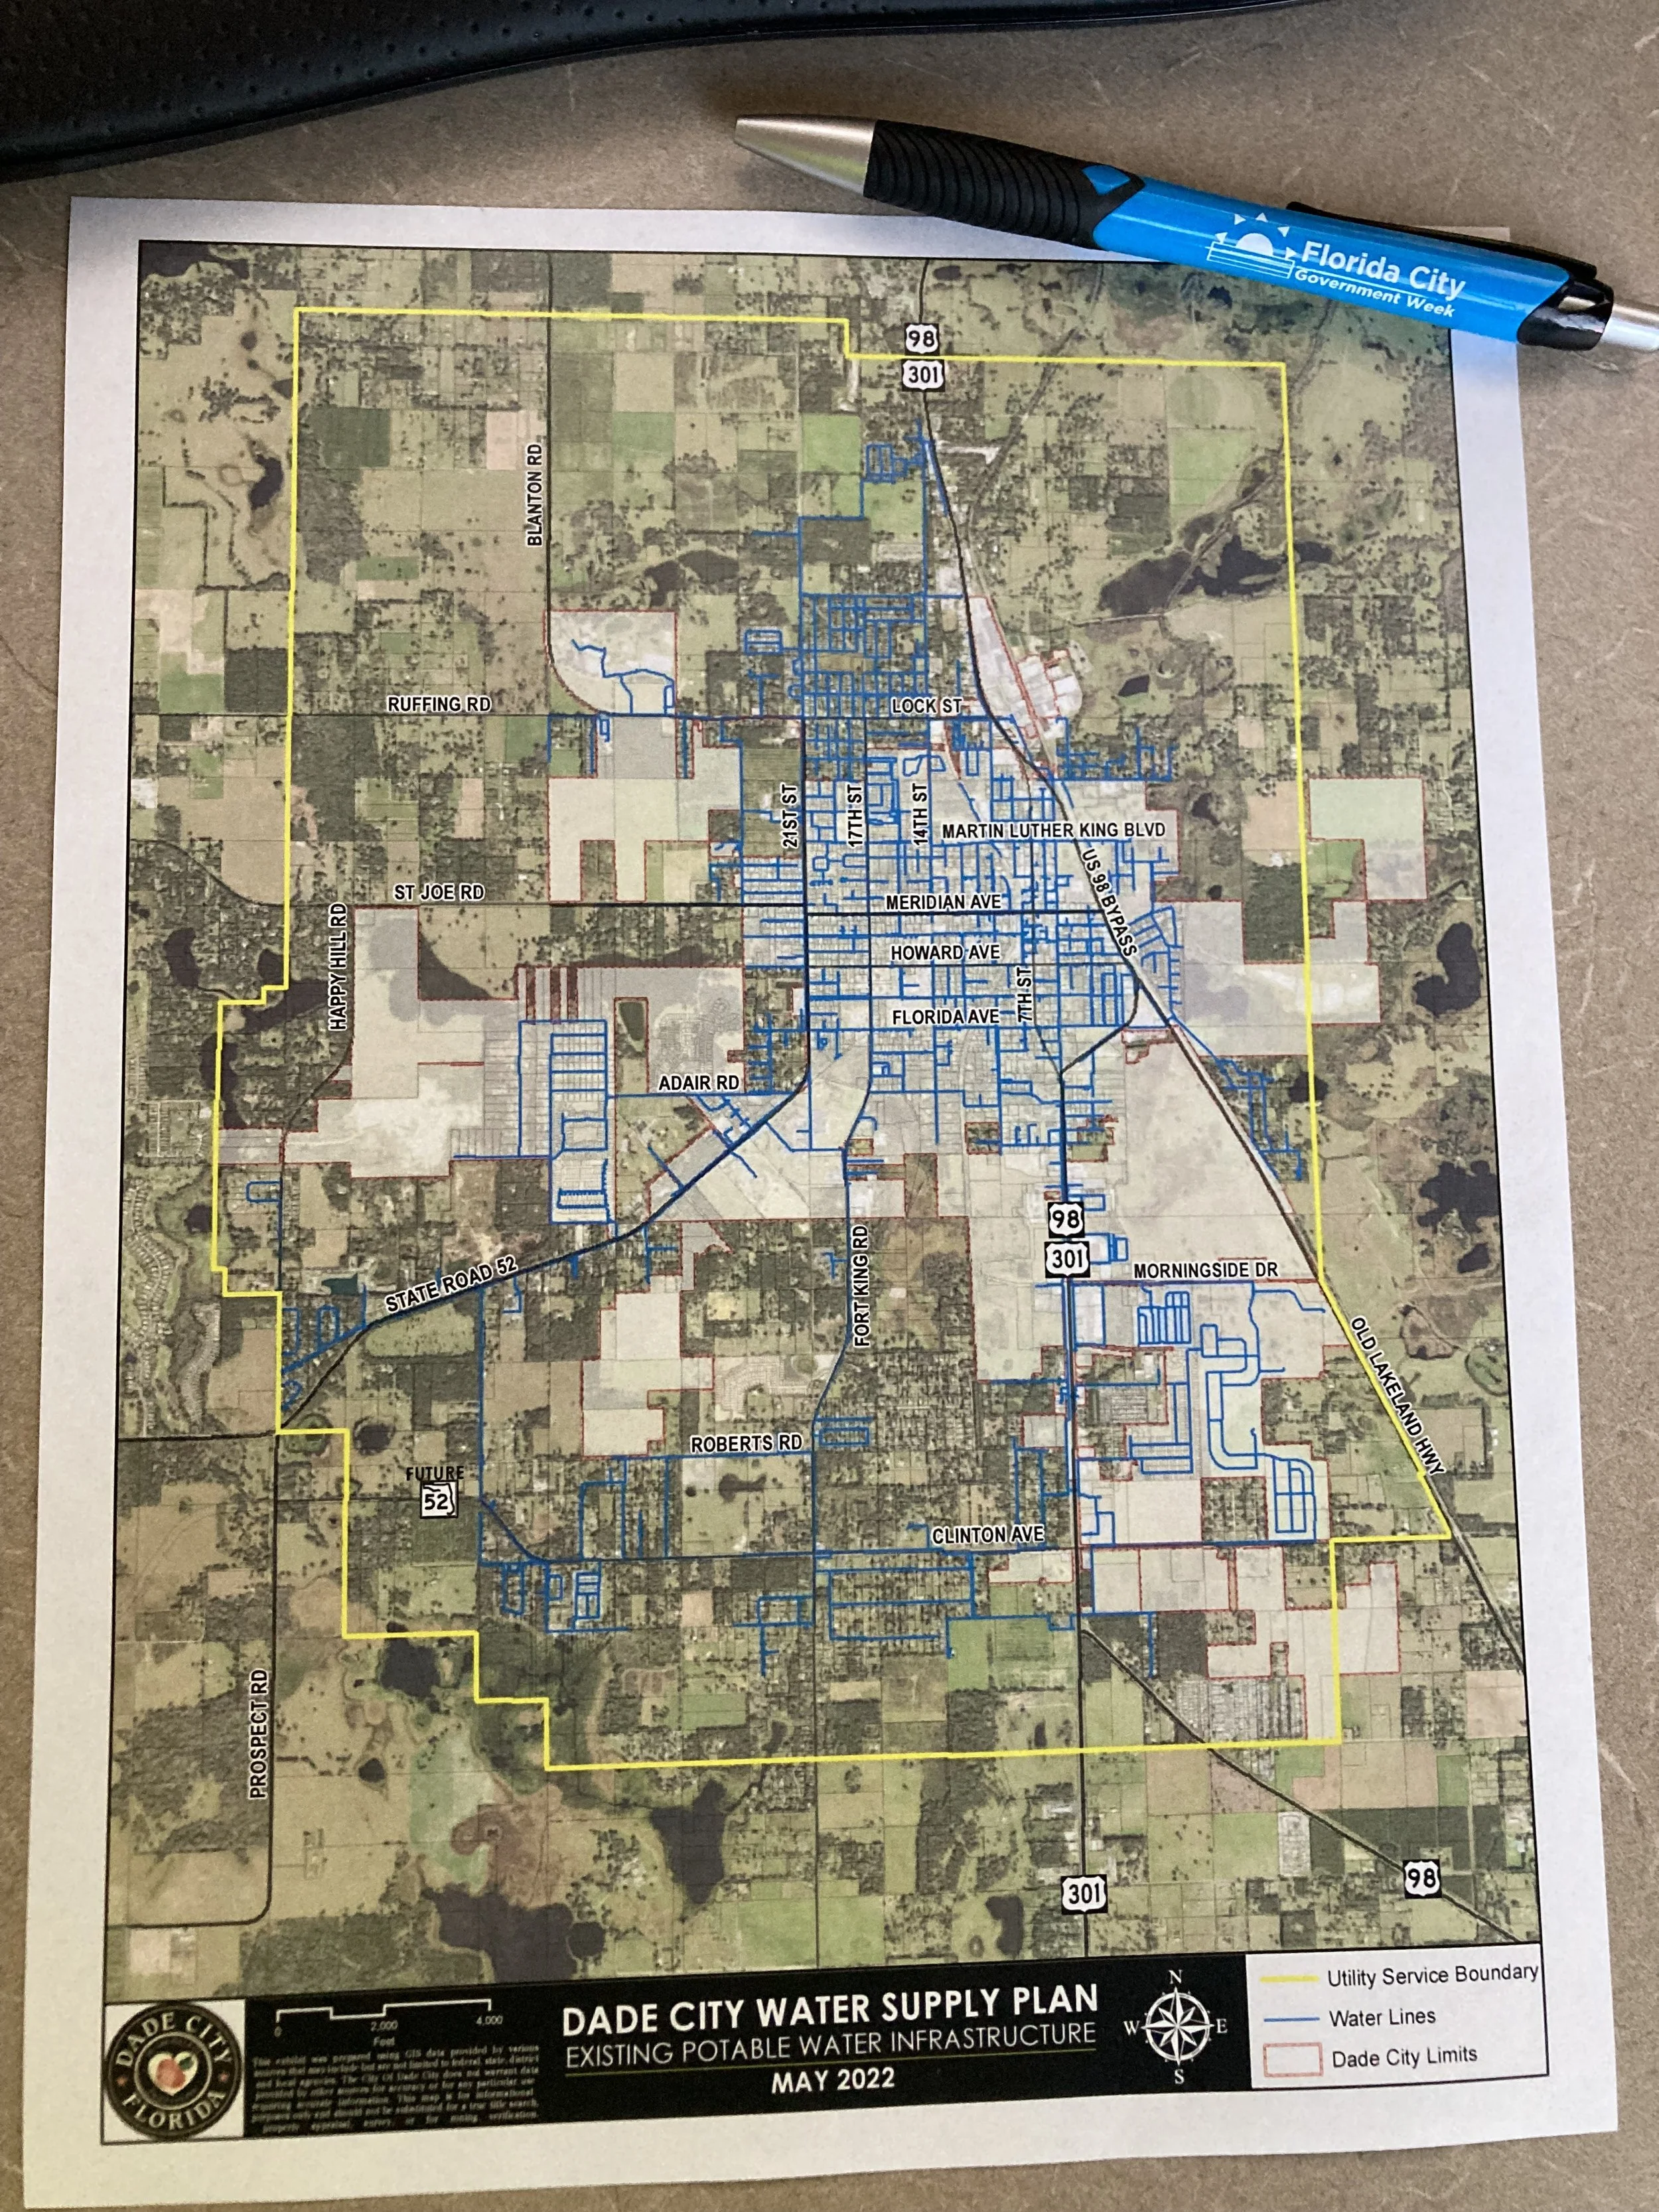
Craig Spatial also integrated GPS‑quality public works data (signs, sidewalk conditions, trees, lights, and other assets) into the asset management service so field workers could access everything in one place. Craig printed and plotted multiple paper maps and larger poster‑size maps to update the legacy maps hanging in field offices.
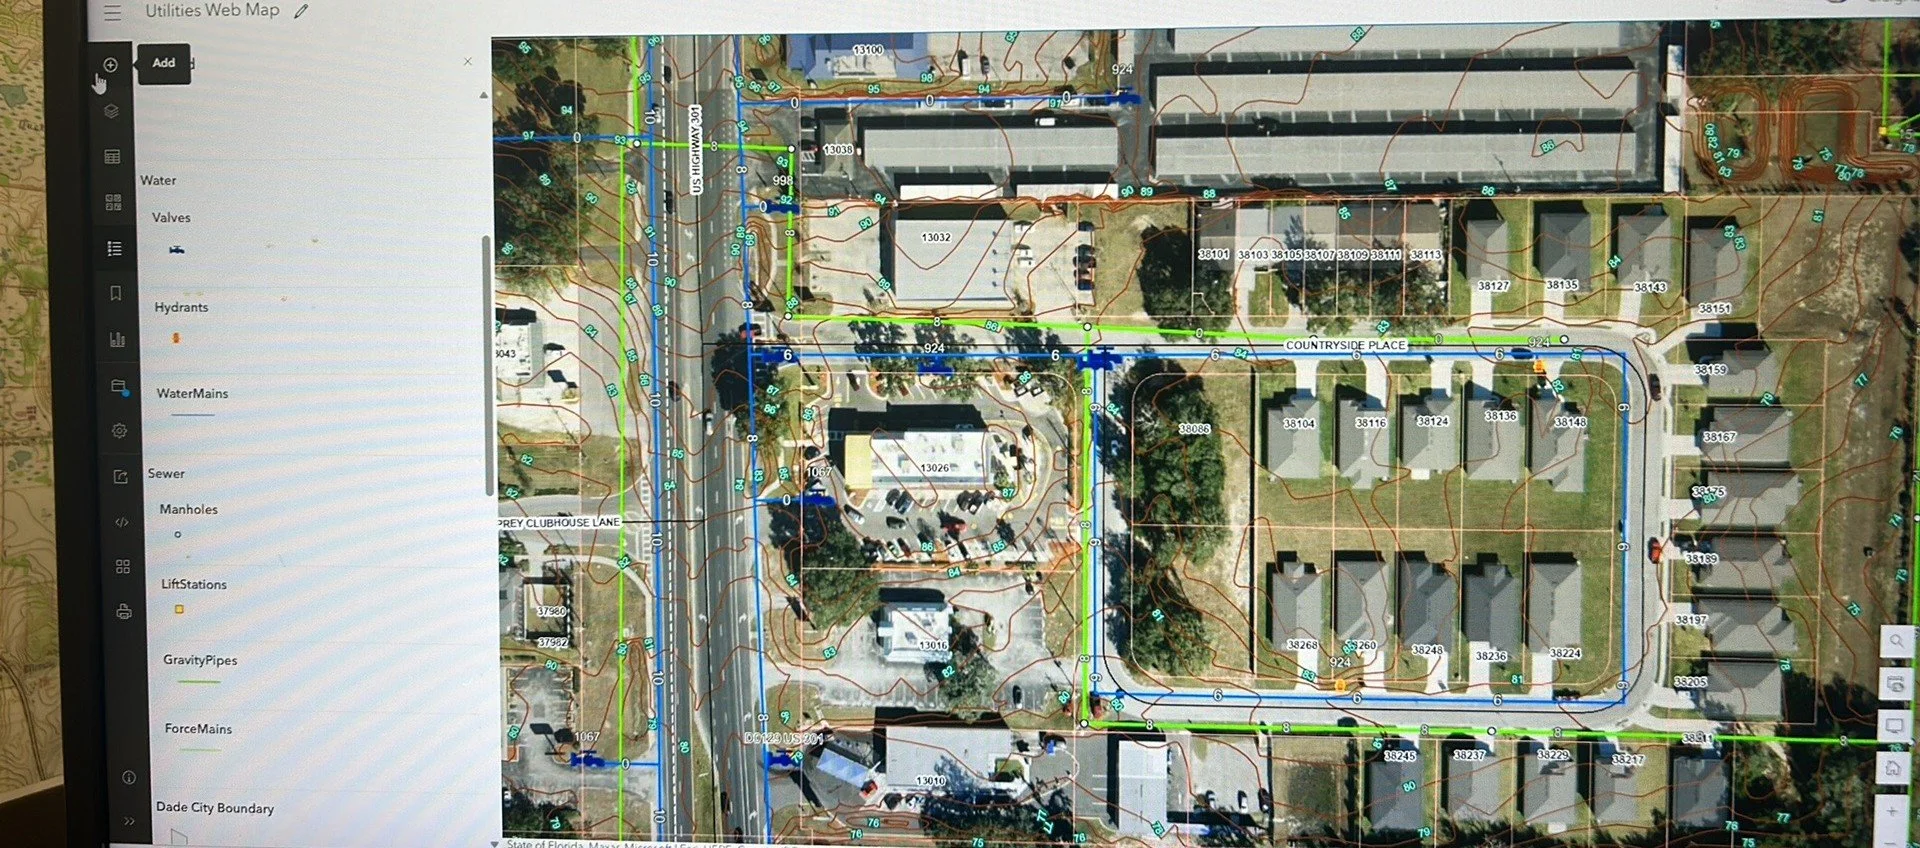
Water lines were symbolized in blue and sewer lines in green to keep the system easy to read in both the office and the field.
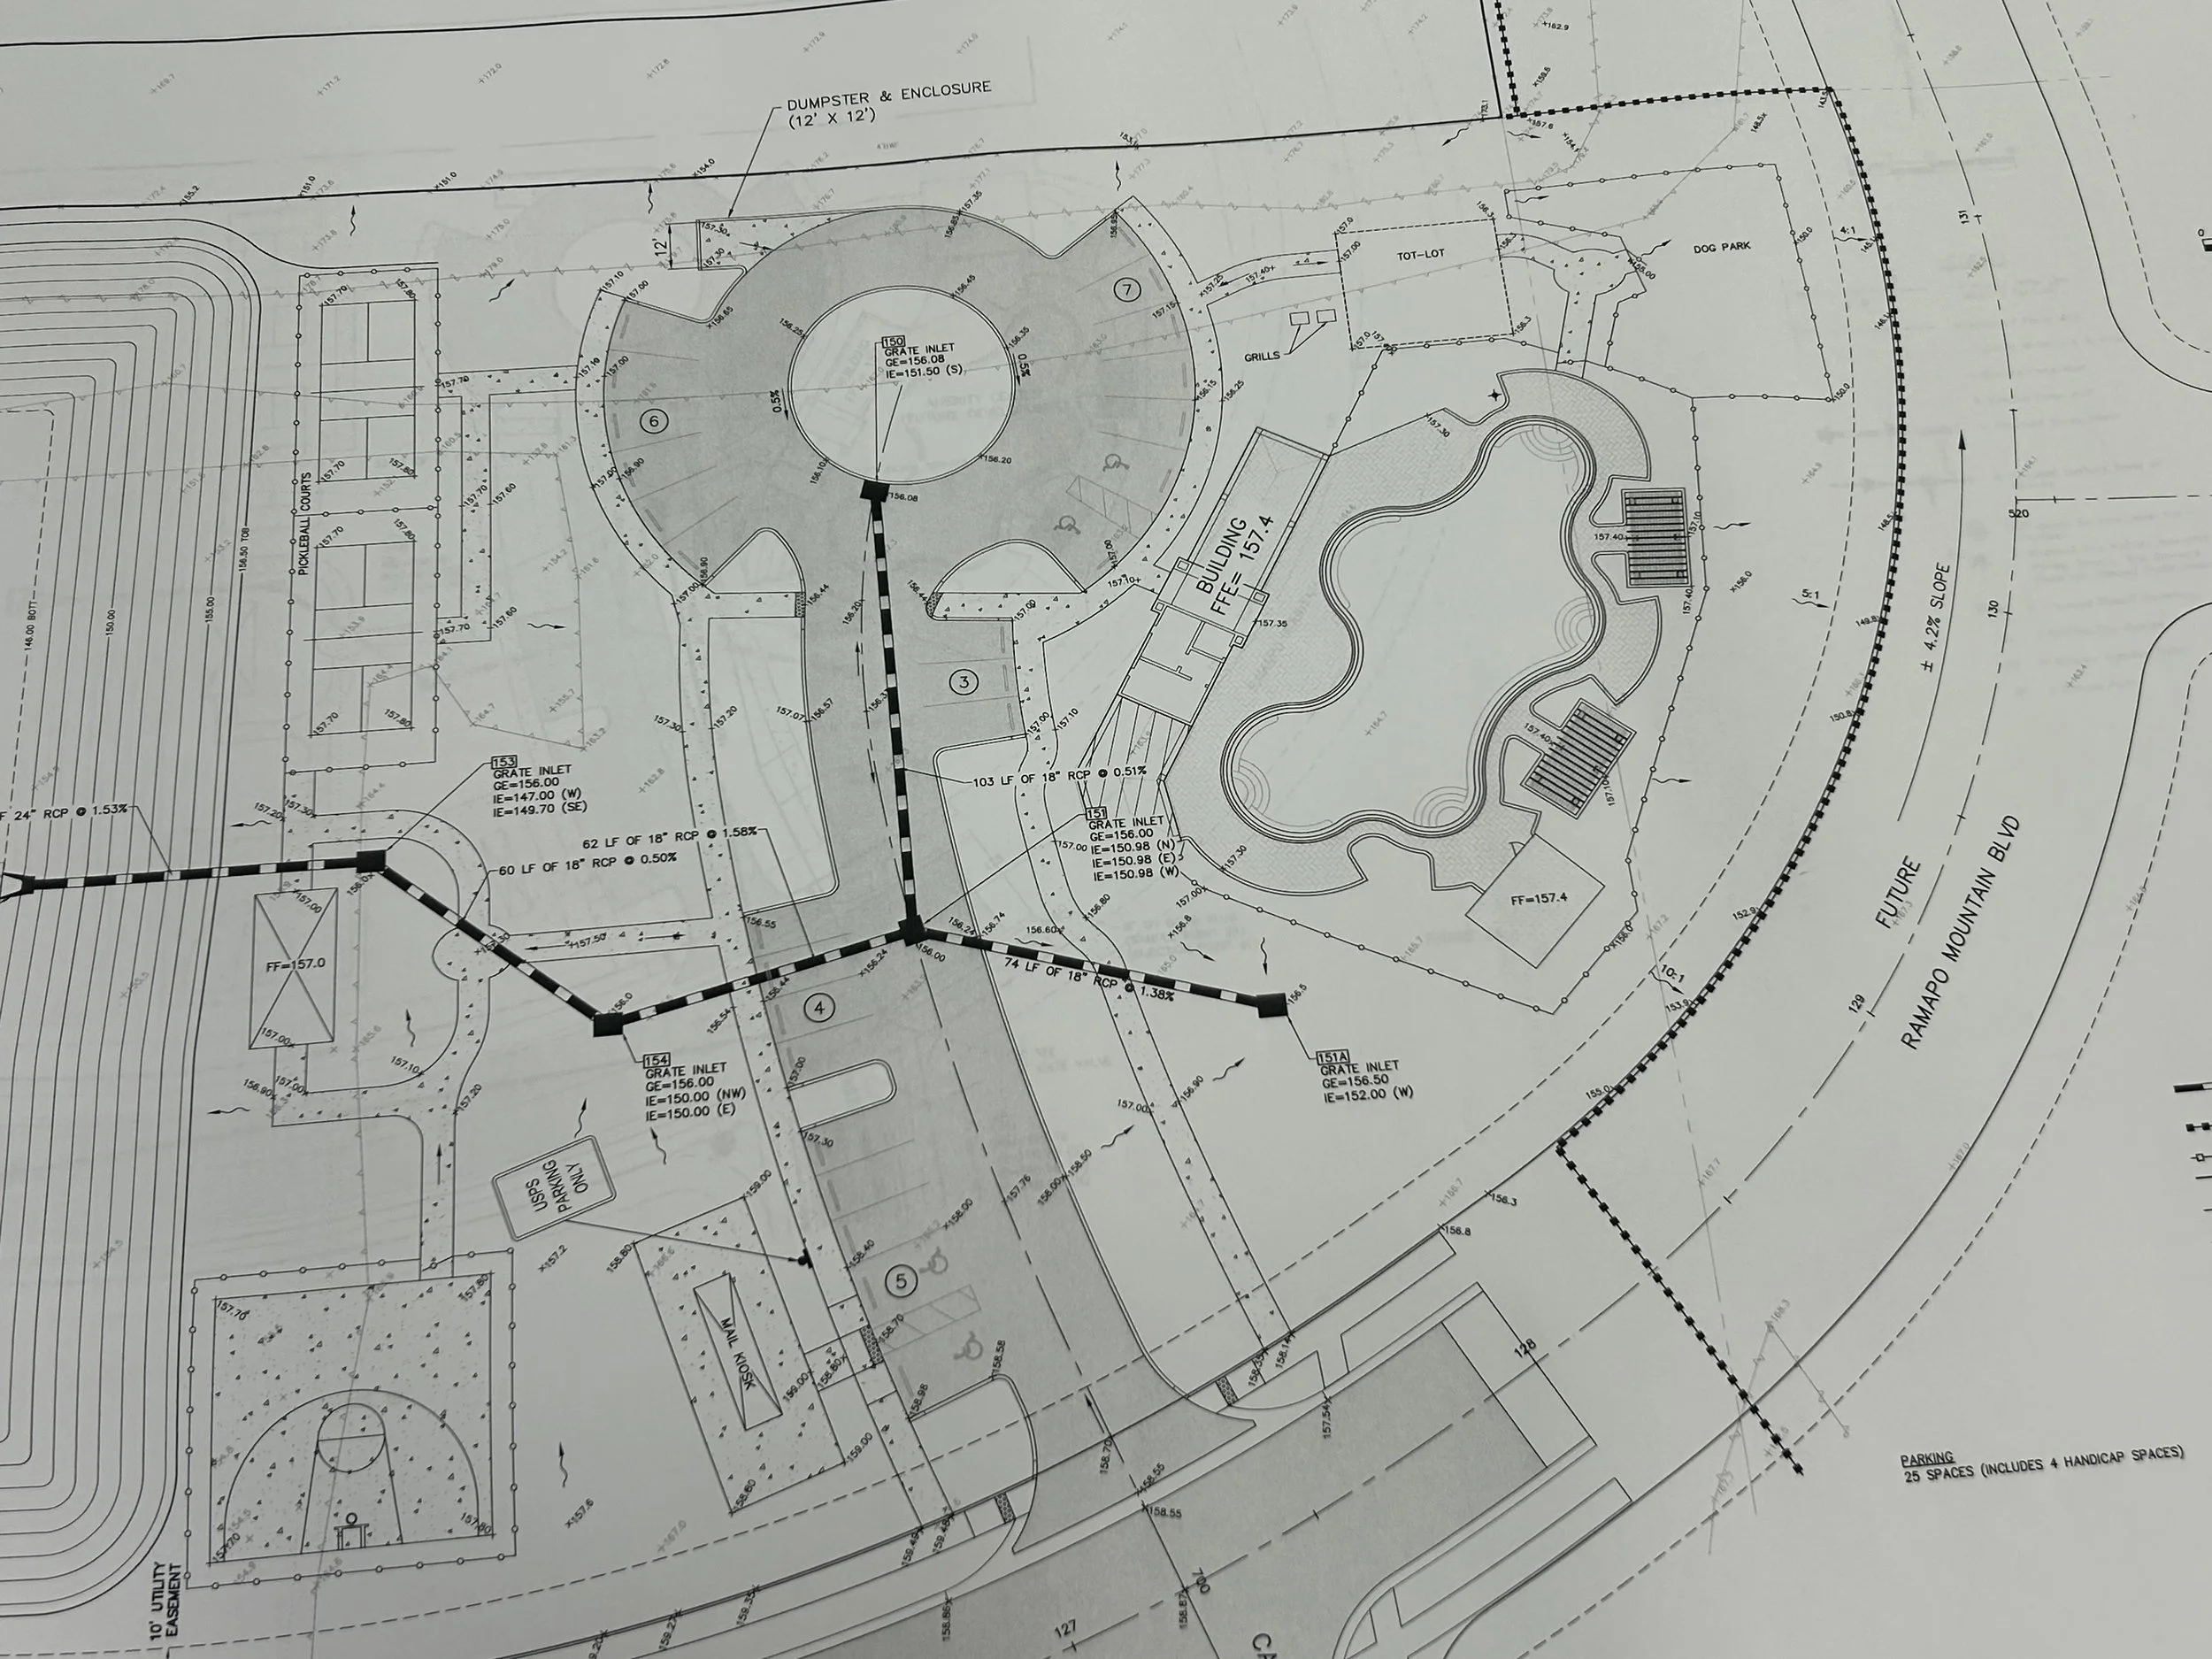
Engineering site plan used as source data for extracting stormwater structures, grading information, and site features before converting them into GIS.