
Value Maps
This series of value maps was created for the City of Dade City, FL to show year‑to‑year changes in assessed value for ad valorem tax purposes. Over five years, Craig Spatial downloaded and processed Property Appraiser parcel data to track how the market was moving, with the results becoming especially interesting during the early 2020s when Florida’s housing market was booming.
The workflow was simple and effective: clip the parcel data to the city boundary, filter for homesteaded houses as requested, sort the table by value, and map the parcels into clear value categories. Green represented higher value and red represented lower value. The map design was intentionally minimal—just parcels and bold street names—so the value patterns stood out without distraction.
Across the series, the red‑to‑green color scheme made the maps feel fun, intuitive, and instantly recognizable. It highlights the year‑to‑year contrasts and makes neighborhood‑level patterns jump out. The most significant jump occurred between 2022 and 2023, with a 24% increase, mirroring broader trends in housing affordability across the Sunbelt and nationwide. The maps offer a clear visual snapshot of value differences across neighborhoods, with many of the highest‑valued and most historic homes located on the south and west sides of town.
The same workflow can be applied to any city in the United States as long as parcel data is available, and it becomes even stronger when paired with Zillow or other market‑based datasets. These value maps show how fast a community can shift and how powerful clean spatial analysis can be for managers, commissioners, and residents.
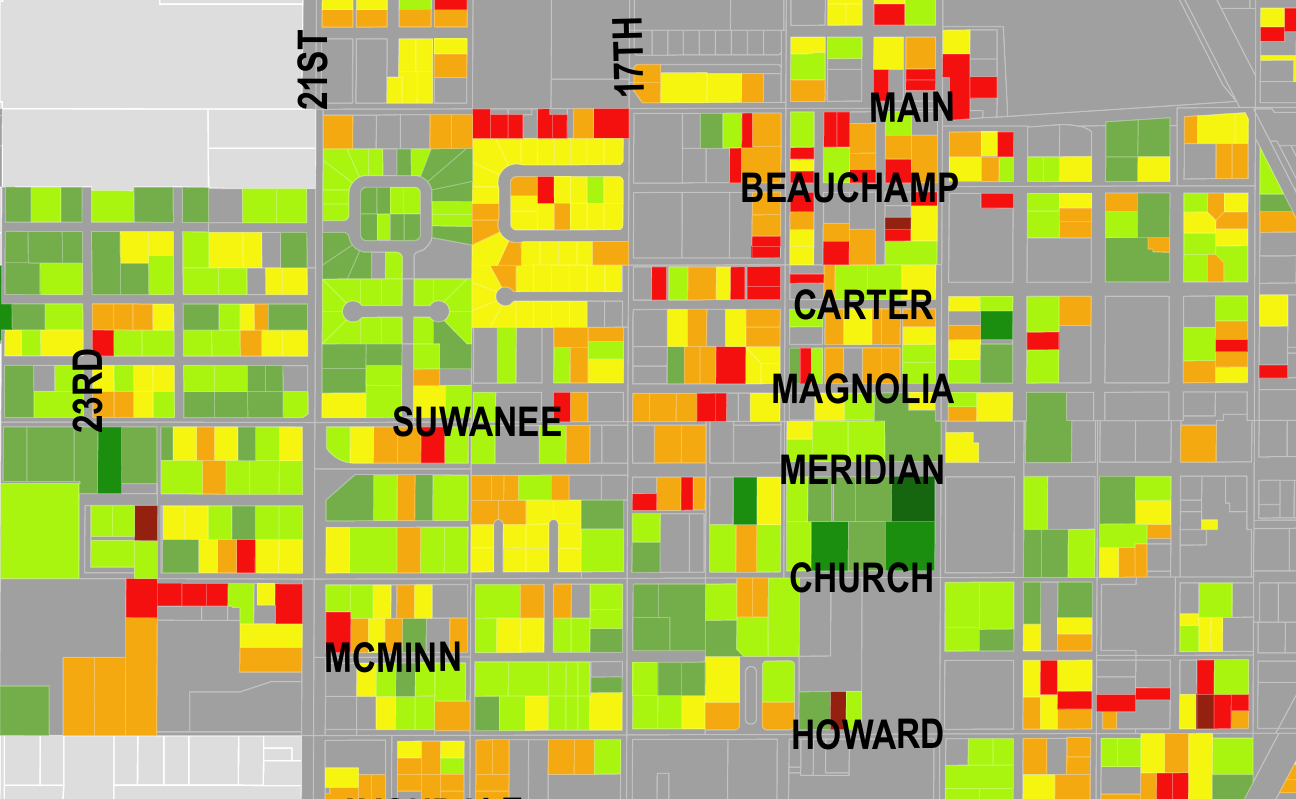
2021
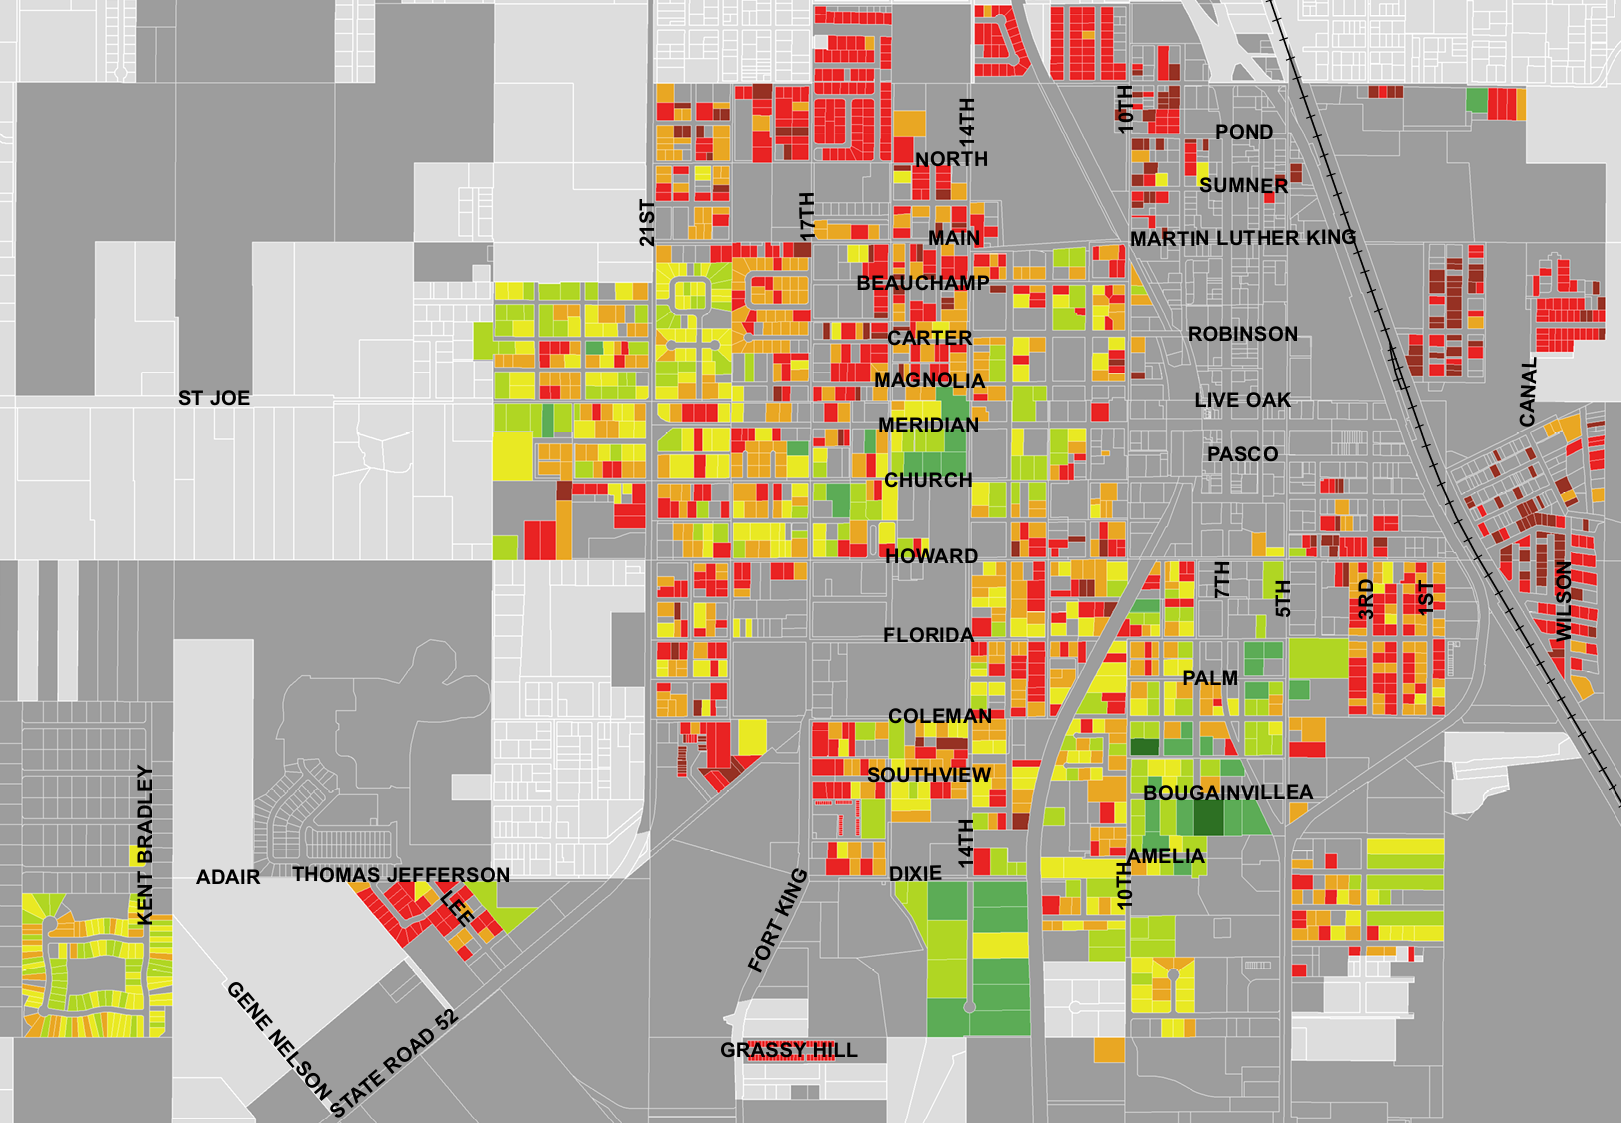
2023

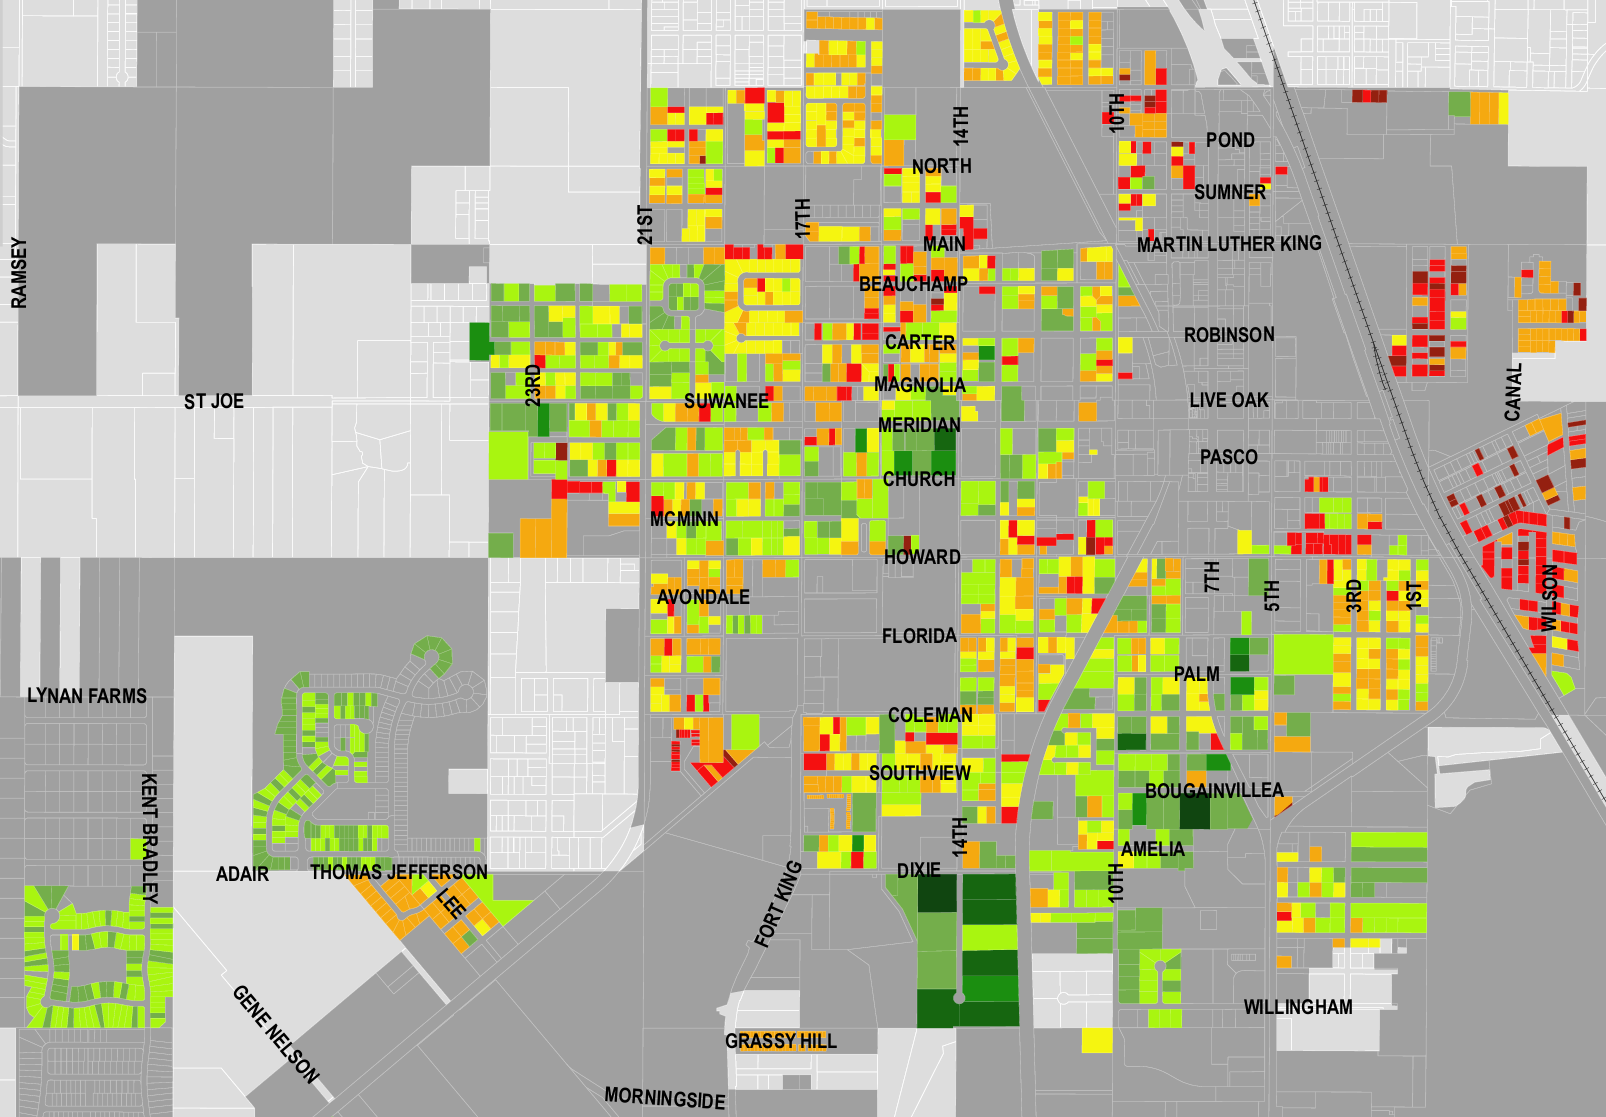
2025
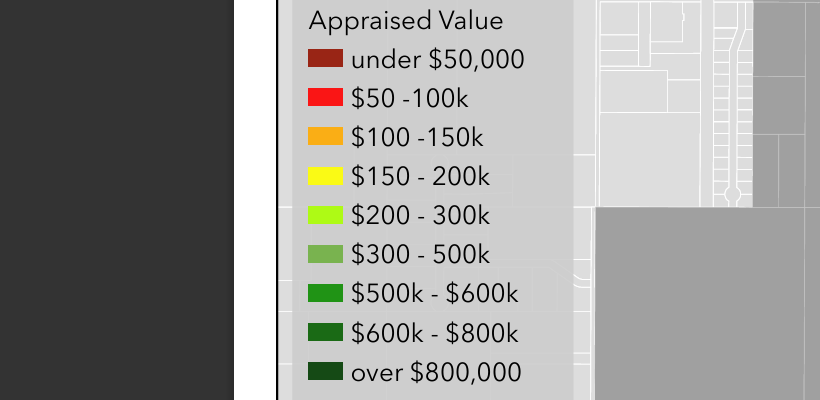
Legend
These three screenshots from the same extent in 2021, 2023, and 2025 show a four‑year growth time‑lapse using the same color scheme, illustrating overall growth as well as how many red parcels shifted into orange, yellow, and eventually green as values increased. Darker green categories were added over time as properties appreciated, and the side‑by‑side comparison makes the change easy to see. The gradient highlights stronger values and higher appreciation in the higher‑elevation and historic neighborhoods in the south and west sides of the city, and weaker values north of downtown and east of the railroad tracks.
Appraised Value value categories:
under $50,000 (dark red)
$50,000 to $100,000 (red)
$100,000 to $150,000 (orange)
$150,000 to $200,000 (yellow)
$200,000 to $300,000 (light green)
$300,000 to $500,000
$500,000 to $600,000 (green)
$600,000 to $800,000
over $800,000 (dark green)